How to Use the Multichart View and Watchlist
The watchlist shows live prices for every instrument. The multichart view lets you follow several markets side by side. Together they help you choose what to trade.
Last updated:
The watchlist
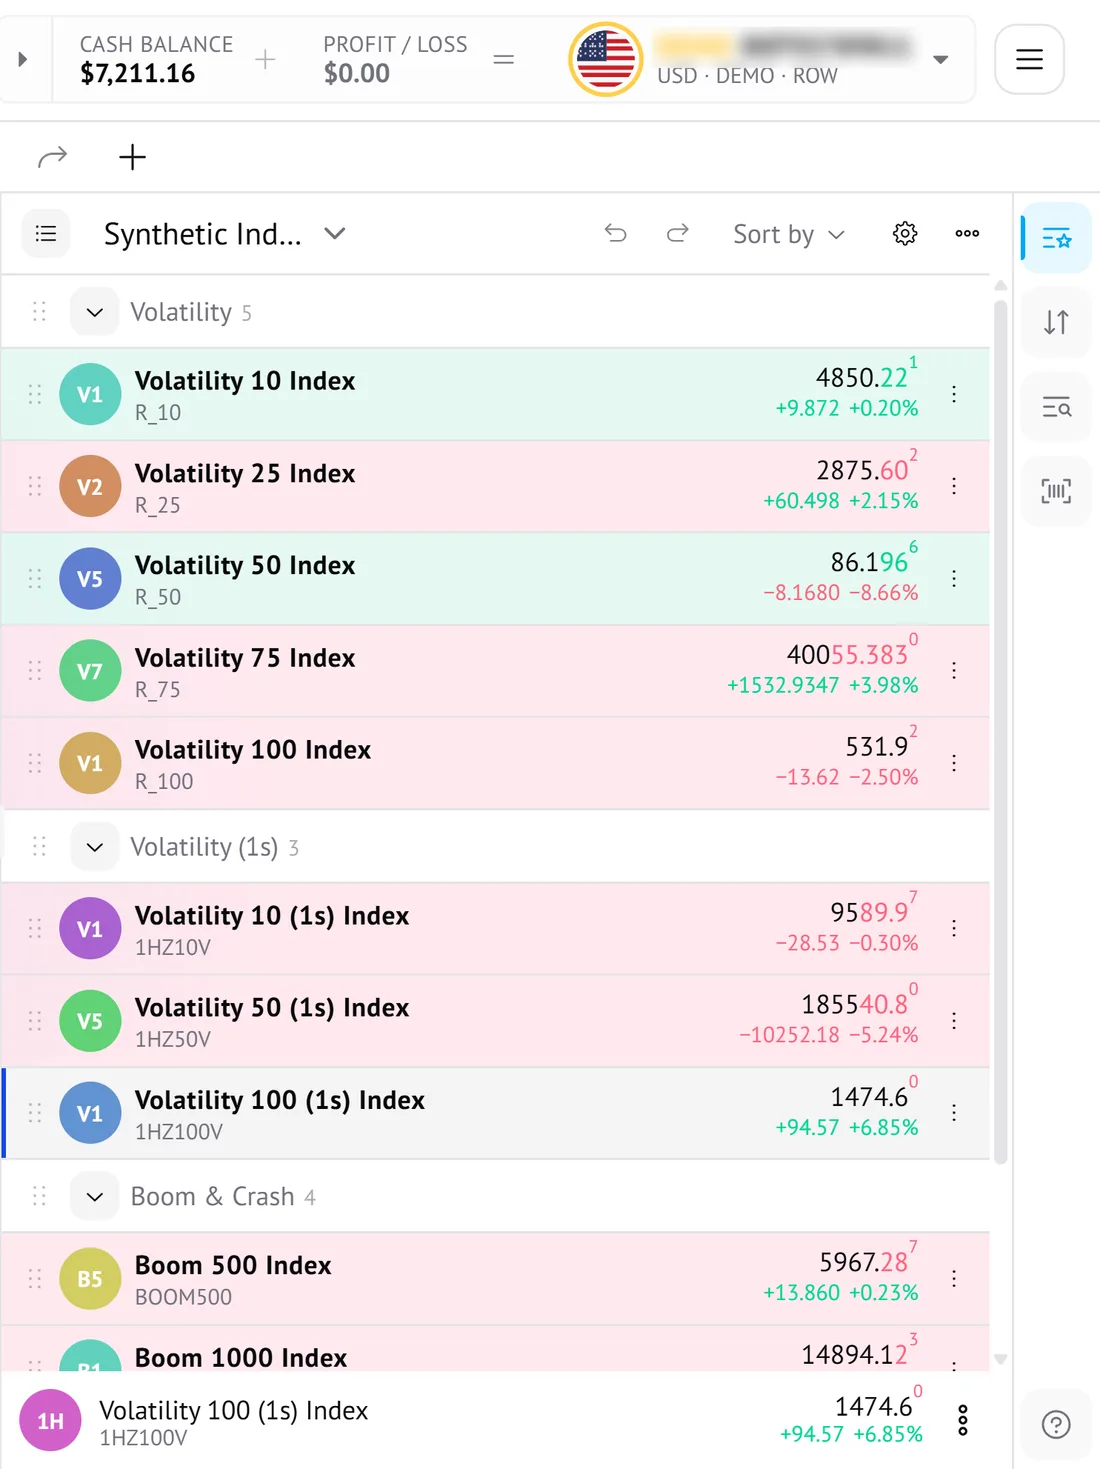
- Instruments are grouped and collapsible, for example Volatility, Volatility (1s) and Boom & Crash.
- Each row shows the live price, its change and its percentage change.
- Rows flash green or pink with each price tick, so movement is easy to spot.
- Sort the list to put what matters first, and select an instrument to trade it.
The multichart view
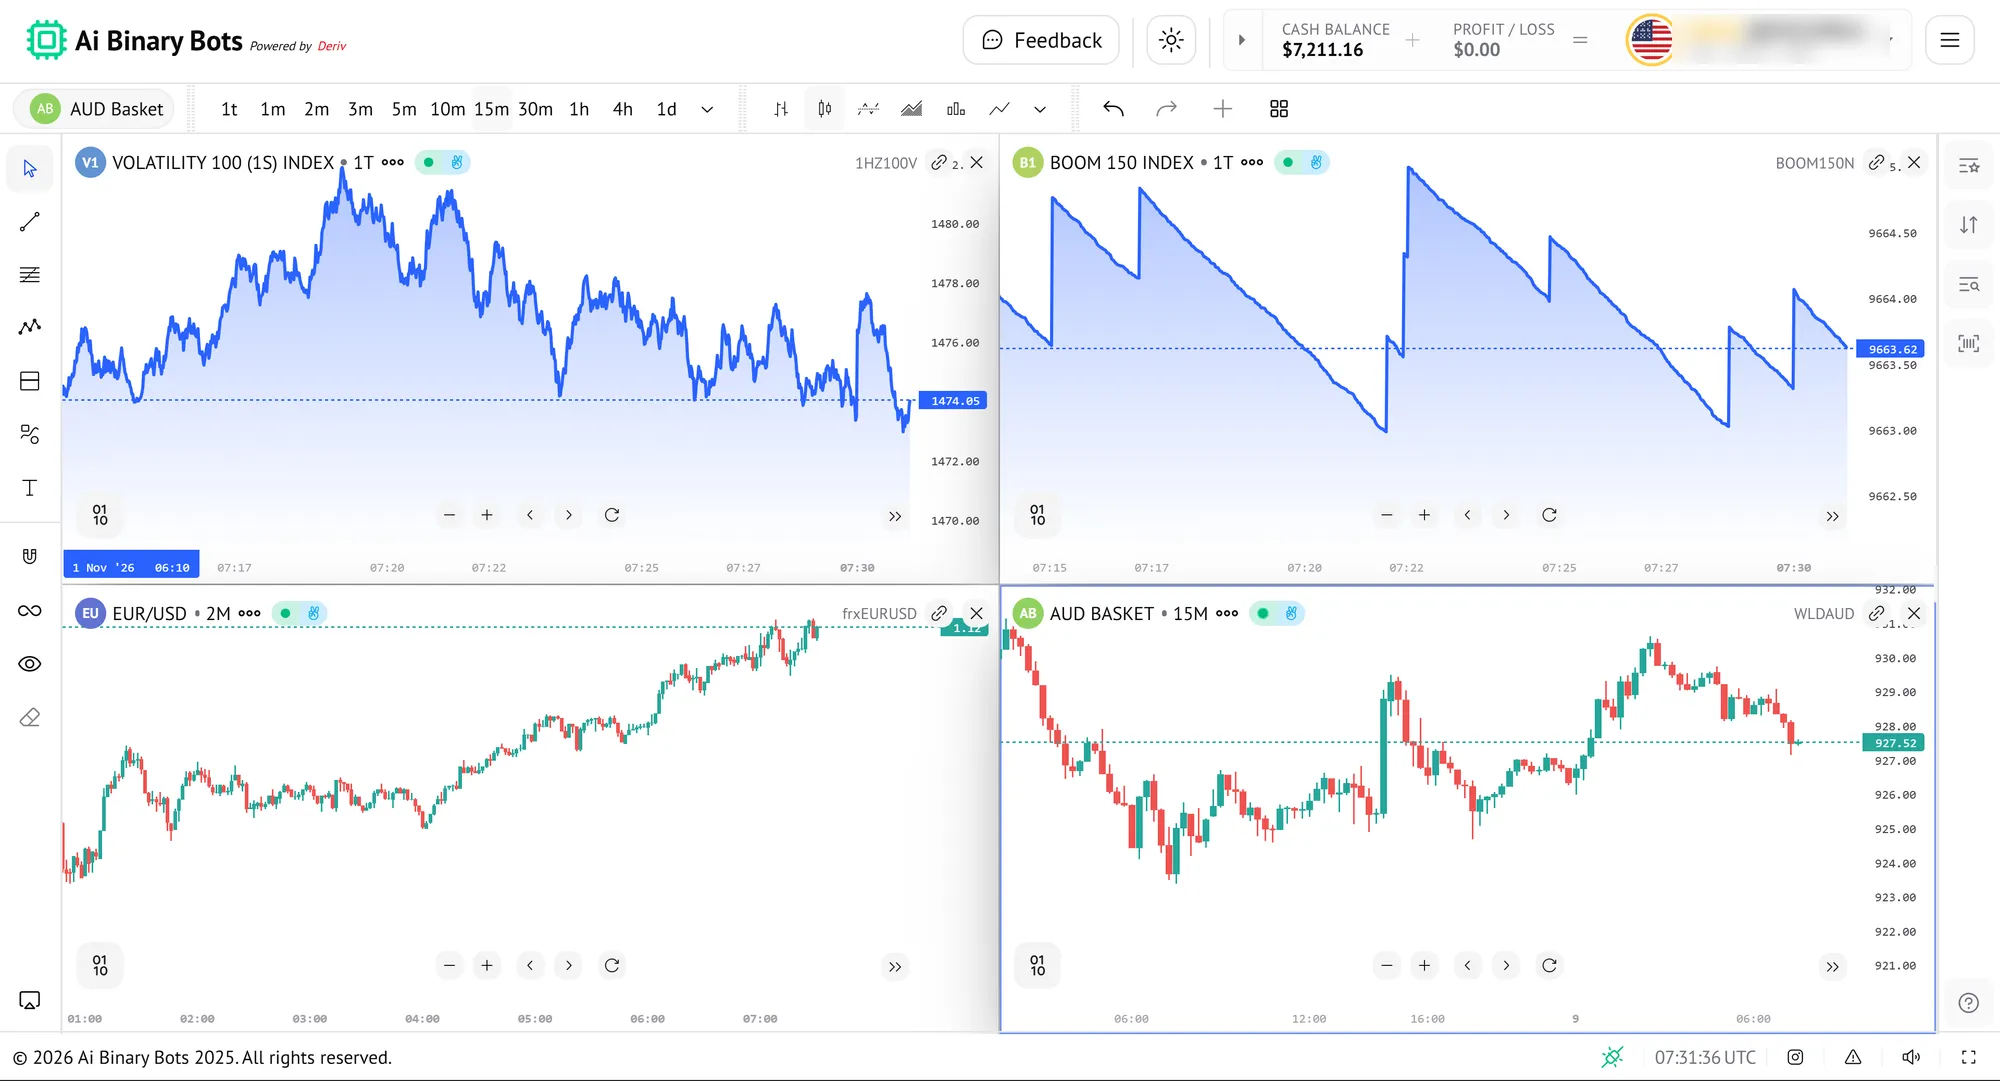
- Open several charts in one window to show markets together, for example Volatility 100 (1s), Boom 150, EUR/USD and AUD Basket.
- Give each chart its own timeframe, from ticks to minutes.
- Mix area and candlestick views.
- Sync charts using the link control on each one.
- Choose your layout from the toolbar.
- Close any chart with one click.
How to use them together
- Scan the watchlist for instruments that are moving, then open them in the multichart view to compare.
- Remember that different markets behave differently. Volatility Indices and Boom and Crash are simulated, while forex pairs follow real currency markets.
- Pick your market, then set up your bot in the Trading Panel.
Practise on a Deriv demo account before you use real money.
Get StartedFrequently asked questions
- Why do watchlist rows flash green and pink?
- They are price-move flashes: the row flashes as the price ticks up or down, so you can see movement at a glance.
- Can each chart have its own timeframe?
- Yes. In the multichart view each chart has its own timeframe and chart style.
Keep reading
- Run your first botEverything you need to start a bot sits in one panel: market, contract, stake, risk limits and strategy. This walkthrough follows the panel from top to bottom.
- Volatility IndicesVolatility Indices are simulated markets with a constant level of volatility. They do not depend on real-world news, and they trade around the clock.
- Boom and CrashBoom and Crash indices drift slowly in one direction and then spike sharply the other way at random moments. The number in the name tells you how often, on average.
Risk warning: Trading binary options involves a high level of risk and you could lose your entire stake. Only trade with money you can afford to lose. This page is educational and is not financial advice.